Search and Discovery
You can use ImageConnect to fine and filter Maxar imagery.
Finding Imagery
At higher zoom levels, Maxar images display in the data frame and are listed in the Table of Contents pane.
The Default Tiled Imagery (WMTS) layer shows Landsat up to zoom level 10, and Maxar high resolution imagery starting at zoom level 11 (about 1:410,000).
Maxar WMS and WMTS are based on Mercator projection zoom levels similar to Google Maps and Bing Maps. These zoom levels correspond only roughly with map scale in ArcGIS, which varies according to the projection you are using, your monitor resolution, and many other factors. The approximate map scales included in this document are for general reference when using a 96-dpi monitor; your configuration may vary.
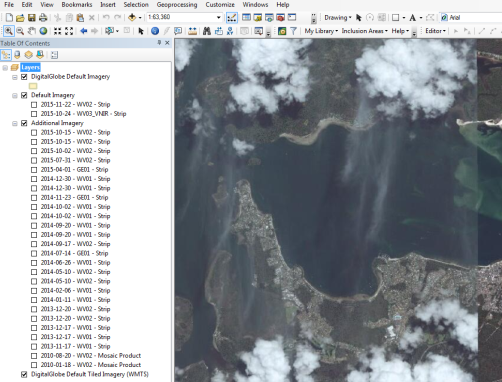
Zoom in on your AOI to zoom level 13 (about 1:68,000) or higher until the Default Imagery and Additional Imagery layers populate:
The Default Imagery layer lists the most recent imagery available to fill the area defined in the data frame, in descending date order.
The Additional Imagery layer lists all other available images that intersect the data frame. If you have performance issues you can turn off the Additional Imagery layer in the Filter Additional Imagery pane. See Filtering Additional Imagery.
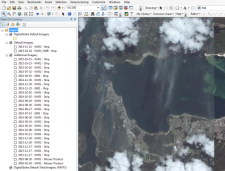
Table of Contents with Default Imagery and Additional Imagery
In the Default Imagery section, select the image identifier to show the image footprint, highlighting how that image contributes to the area defined in the map view.
To turn off this highlighting, in the toolbar, select
 .
.
Image Highlighted in the Data Frame
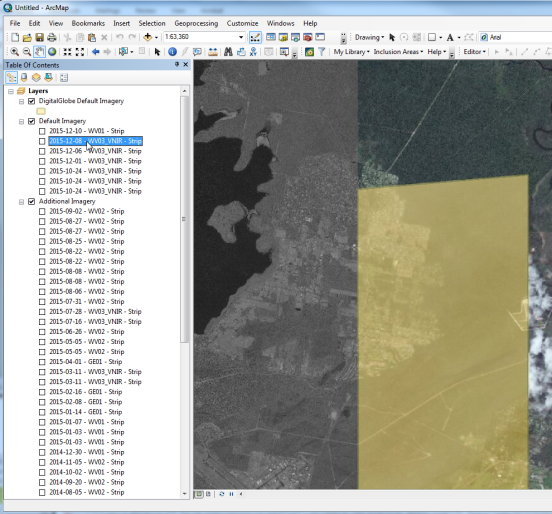
Select one or more images from either list to show those images in the data frame. Drag the layers or the images within a layer to change the stacking order.
Use the ArcMap Effects toolbar to select an image from the Default Imagery or Additional Imagery layers and show as transparencies, or use the swipe tool to peel the selected layer back and see underneath it.
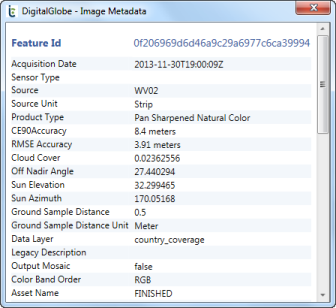
To view metadata for an image, right-click the image in the list and select View Metadata. The Image Metadata pane opens.
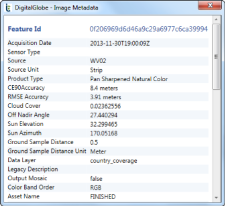
Image Metadata Pane
Filtering Additional Imagery
To open the Filter Additional Imagery pane, select the Filter images in the Additional Imagery Group layer icon.
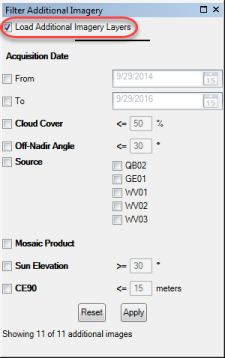
Filter Additional Imagery Pane
To activate or deactivate the Additional Imagery layer, select or clear the Load Additional Imagery Layers checkbox.
Clearing the checkbox removes the layer from the Table of Contents and improves performance by turning off service calls for that layer.
- Set the filters as desired and select Apply.
- To remove filters, select Reset.

Working with the Refined Persistent Change Model
Refined Persistent Change Model (RPM) is a vector dataset, produced by MDA under contract to the NGA, that depicts annual changes that were detected based on 30-meter Landsat imagery. Maxar hosts this dataset within G-EGD and makes it available via ImageConnect.
MDA delivers the dataset to the NGA annually and divides those deliveries into six regions, or AOIs, which are produced and delivered at different points throughout the year. A map roughly defines the boundaries of each AOI.
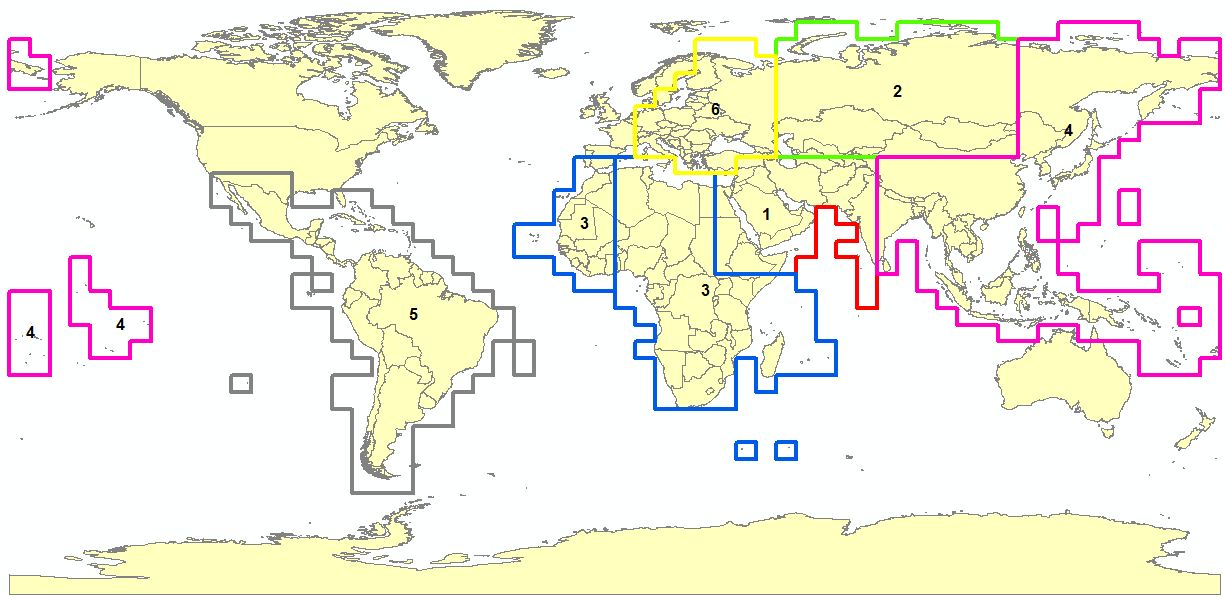
RPM Regional AOIs
By default, the RPM layer is turned off for best performance. To turn on the RPM layer, zoom to about 1:34,000 or lower and select the RPM Change Detection Polygons layer checkbox. The RPM layers are listed in the Table Of Contents pane and the RPM polygons are visible in the data frame.
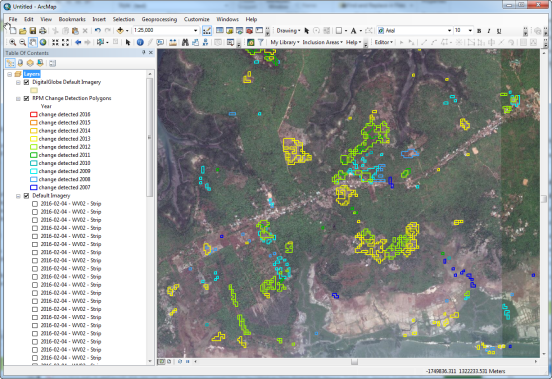
RPM Layers and Change Polygons
To download the RPM polygons that are currently visible on your map as a shapefile, select the ImageConnect menu, then select Download RPM Polygons.
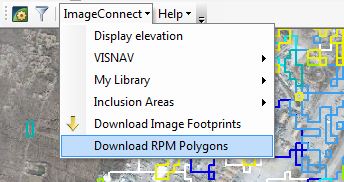
Download RPM as Shapefile
After the download to shapefile is complete, the newly created RPM shapefile is automatically added as a new layer in your ArcMap Table of Contents.
Displaying the VISNAV Global Land Use/Land Cover Dataset
VISNAV is a global land use and land coverage classification dataset that utilizes 30 land classification categories to associate every part of the earth with a type of land cover.
This VISNAV dataset can now be viewed as a map layer while using ImageConnect. To add the VISNAV layer, select the ImageConnect menu, then select VISNAV > Display VISNAV Layer.
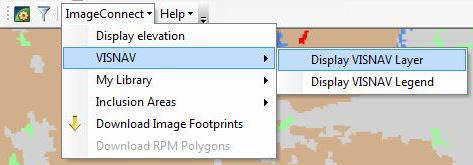
VISNAV Menu
After the VISNAV layer has been turned on, it is added to the ArcMap Table of Contents, where it can be toggled on or off.
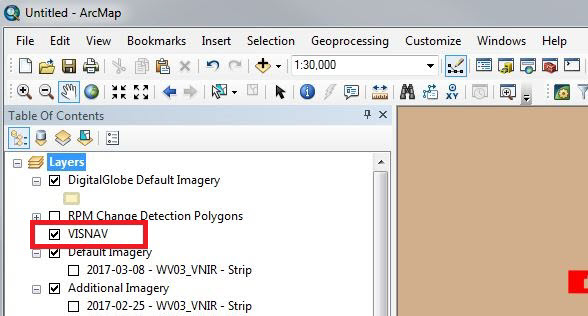
VISNAV Layer
| For the VISNAV layer to display and be turned on, your map must be at a scale of 1:300,000 or greater. |
To display the VISNAV legend, select the ImageConnect menu, then select VISNAV > Display VISNAV Legend. This option provides a VISNAV legend for your reference in the viewport.
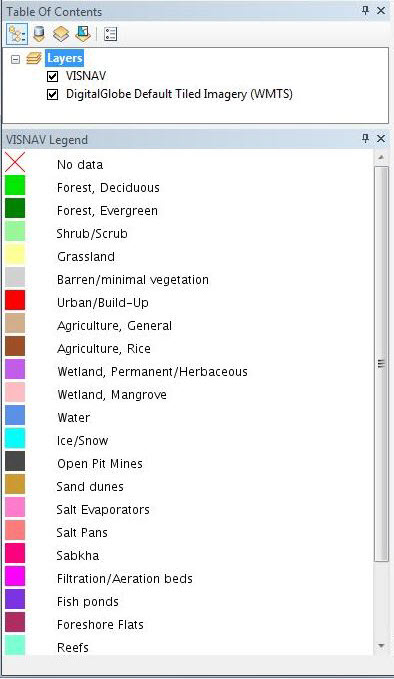
VISNAV Legend