Mineral Identification from Space
Powerful instruments onboard Maxar satellites are capable of detecting a much wider spectrum of light than our human eyes can see. The images they produce make it possible to detect an unseen world.
Background
DigtialGlobe's WorldView-2 and WorldView-3 satellites are both equipped with instruments that collect imagery as panchromatic (black and white) and 8-band multi-spectral in the Visible and Near Infrared (VNIR) range. Individually and collectively these bands have the power to provide insights into natural and man-made activity on the ground.
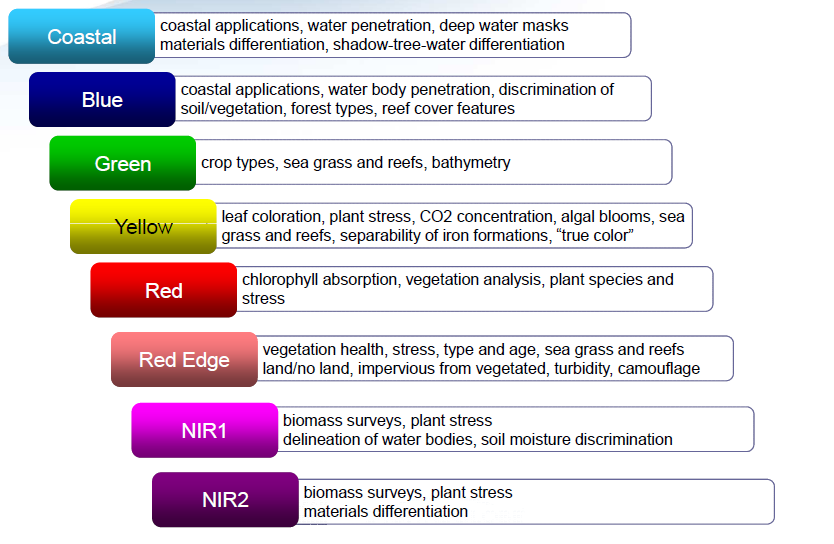
WorldView-2 and WorldView-3 collect high resolution 8-band VNIR multispectral imagery where each band reveals insights about activity on the ground.
WorldView-2 and WorldView-3 collect high resolution 8-band VNIR multispectral imagery where each band reveals insights about activity on the ground.
WorldView-3 carries an additional instrument that detects light in the Short Wave Infrared (SWIR) spectrum. SWIR imagery allows analysts to unlock further insights such as the location of a fire through smoke, separation between vegetation and man-made materials, identification of iron/steel, plastics/polymers, paints, and the detection of minerals associated with a variety of mining activities.

WorldView-3 collects 30cm resolution panchromatic imagery, as well as high resolution VNIR and SWIR bands to truly reveal what cannot be seen by the naked eye. This figure shows all 16 bands on WorldView-3, the light output of the sun (in light gray), and the atmospheric transmission "windows" in dark gray shades.
Visualizing Multi-spectral Imagery
Standard color imagery is called natural color imagery, and it is visualized by mixing the red, green, and blue spectral bands – similar to how a printer makes a color copy using cyan, magenta, and yellow ink. To visualize non-visible bands within the VNIR and SWIR range, analysts can produce false color composite images. False color images mix different bands into the red, blue, and green display channels. For example, to detect vegetation using VNIR imagery, an analyst mixes the near infrared 1, red, and green bands. This combination displays healthy vegetation as bright red, and creates a sharp contrast between other earth landcover materials.
Material Identification
WorldView-3 was the first commercial satellite to have 16 high-resolution spectral bands that capture information in the visible to near-infrared (VNIR) and short-wave infrared (SWIR) regions of the electromagnetic spectrum (EMS). Operating at an altitude of 617 kilometers, the satellite provides 31-centimeter panchromatic resolution, 1.24-meter VNIR resolution, and 3.7/7.5-meter SWIR resolution, according to our operating licenses (Department of Commerce). The VNIR instrument collects spectral data with 11-bit radiometric resolution, and the SWIR instrument operates at 14-bit resolution.
The 16 spectral bands cover a range of diverse and unique spectral absorption features (natural signatures) for materials and minerals of interest to industries such as mining, energy, insurance, environment, and defense. Leveraging these spectral signatures from space supports applications that improve decision making for resource exploration, infrastructure planning, and operational management.
How it Works: SWIR for Material Mapping
WorldView-3's spectral bands allow for direct material identification and chemical measurements. Energy from sunlight is either reflected away from earth materials or absorbed into its molecules as heat, and these patterns of reflection and absorption form distinctive spectral signatures. Based on the material or mineral content, different surfaces absorb specific wavelengths of light and reflect others. Absorptions in the SWIR wavelengths can be used for detecting materials containing compounds such iron, plastic or polymer, paint binder materials, clay, carbonates, ammonium, and sulfates.
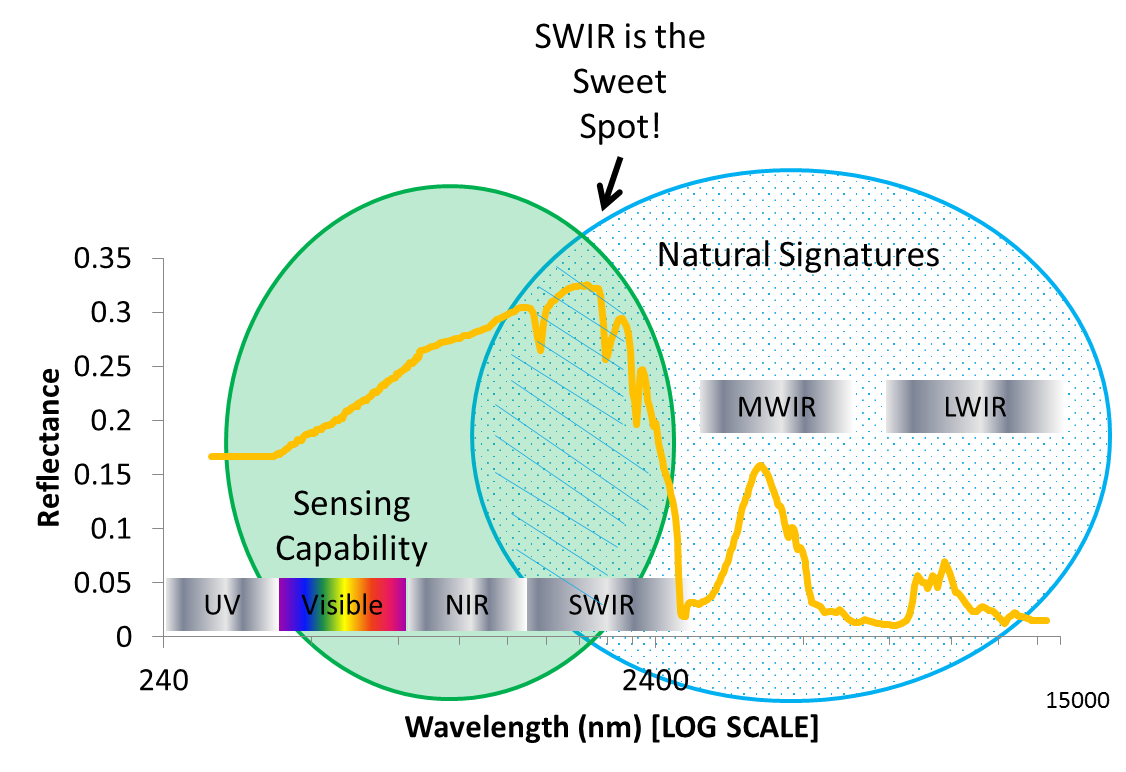
A spectral signature of the mineral kaolinite (in yellow) across a wide range of wavelengths. It shows that the natural absorption-feature signatures occur between the SWIR and LWIR wavelengths; that the visible range of wavelengths lack distinctive spectral signatures; and that the detection capability of WorldView-3 SWIR intersects with naturally occurring signatures. Kaolinite is not the only material with this pattern – many materials have unique signatures only in the SWIR and longer wavelengths. An instrument that detects only in the visible or NIR range will not be able to exploit the natural signatures for material identification.
For resource exploration, "indicator minerals" detected by spectral signatures strongly suggest the location of potential mineral ores or sub-surface deposits—allowing predictive SWIR "minerals maps" to be created over an area of interest. For infrastructure mapping, separating iron and steel, plastics and polymers, clay, concrete, and paint allow us to map building and rooftop construction materials. This allows, for example, a first responder to receive in-vehicle information about a burning structure before arriving at the site. Insurance industries can make better predictive analyses over large areas by knowing construction materials. Investment companies can make more accurately informed decisions about industrial facilities in remote parts of the world. And defense and intelligence can detect human activity by finding paint, steel, or polymers in unexpected locations.
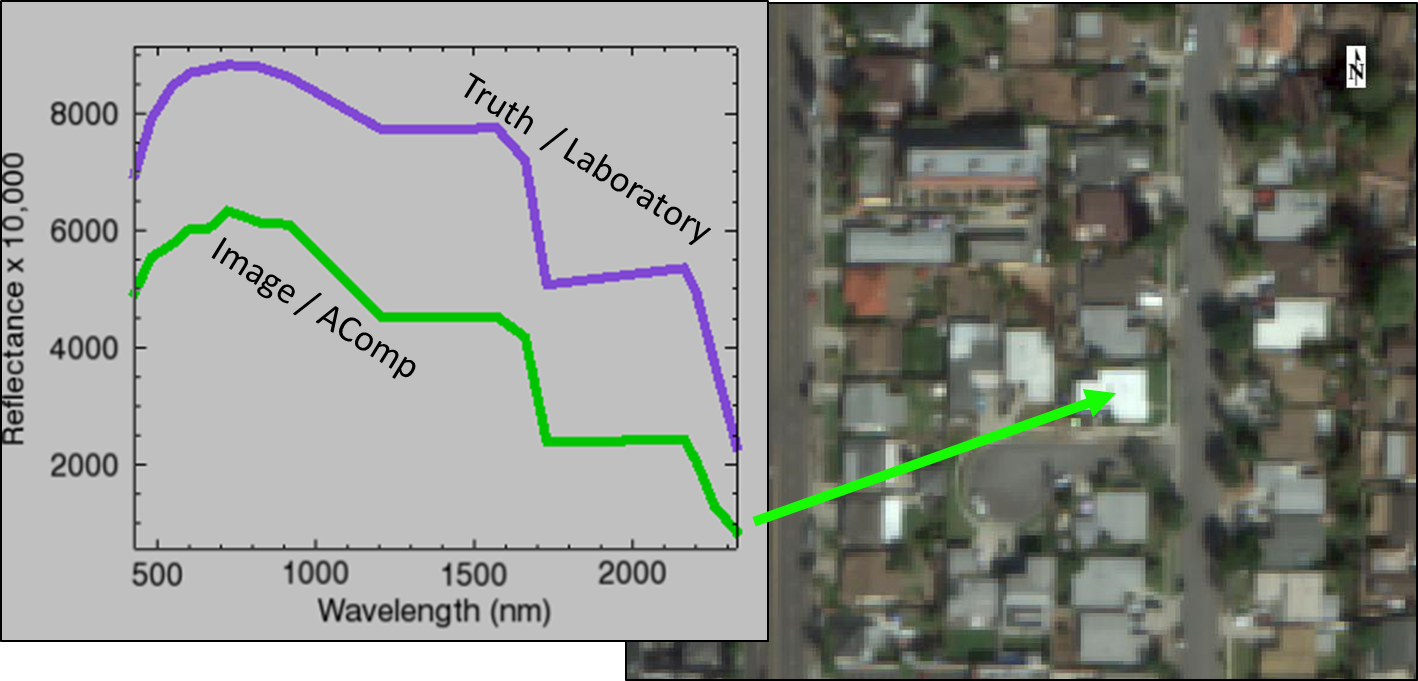
A comparison between a known or truth spectral signature (in purple) and a spectral signature from a WorldView-3 image (in green) that has been processed with AComp. It shows the high quality spectral signature that can be collected from space.
WorldView-3 vs. ASTER
Using SWIR to create material maps is nothing new. ASTER, an imaging instrument onboard the Terra EOS satellite, provided 6-band SWIR capabilities after launch in 1999. But the advancements in technology offered by WorldView-3 are striking.
- Resolution ASTER's SWIR capabilities are limited to 30 m resolution. WorldView-3 is the only commercial satellite that collects at 3.7 m resolution in the SWIR bands—almost 10 times better than ASTER.
Atmospheric CompensationMaxar's Atmospheric Compensation (AComp) not only automates the crucial exploitation task of converting satellite spectral data to physical units of reflectance, but also improves the quality and clarity of satellite images taken under a range of atmospheric conditions—making SWIR data more consistent and reliable at a regional or national scale.
AComp is not available in G-EGD.
- Currency Unfortunately, ASTER stopped functioning in 2008—so if an ASTER scene is not in the archive, it cannot be collected. While the Earth's rocks haven't changed that much in the intervening years, the social and political situation on the ground is radically different. The currency of WorldView-3's imagery helps customers safely and efficiently allocate resources in the exploration phase.
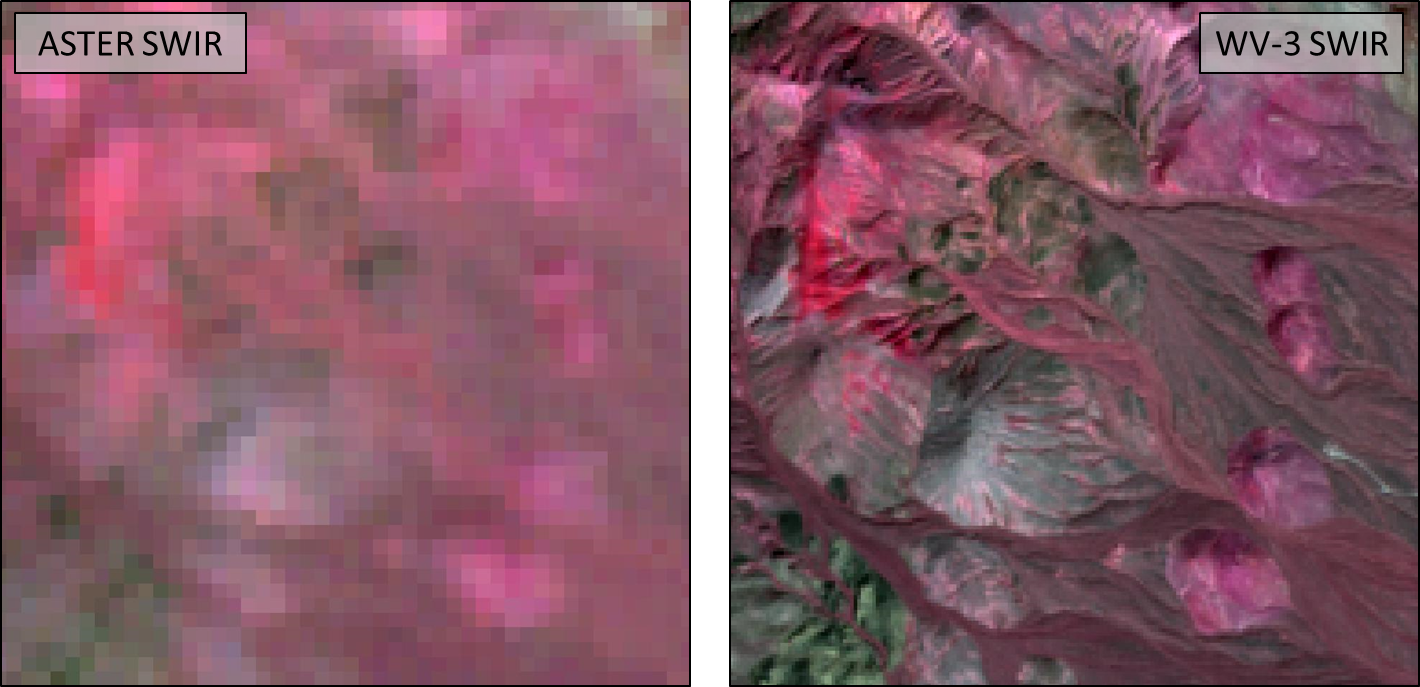
A comparison of WorldView-3 SWIR on the right (7.5 m pixels) and ASTER on the left (30 m pixels). Both are similar color composites (R-G-B) of WV-3 bands 11-14-15 and ASTER bands 4-6-7.
Exploitation of Spectral Imagery
There are three distinct ways to visualize material information using SWIR data.
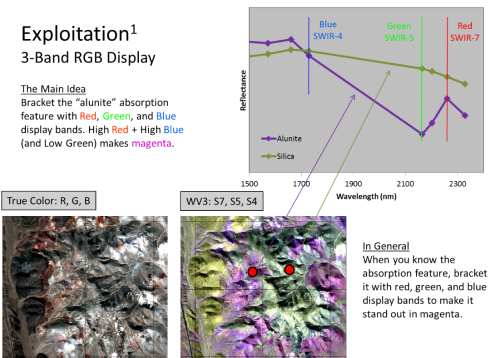
- Color Composite Choose red, green and blue display colors for sets of three SWIR bands. The combination of colors highlights a mineral category, making it clearly stand out on the imagery. Some band combinations come from experience with the ASTER sensor, others are unique to the WV-3 capabilities.
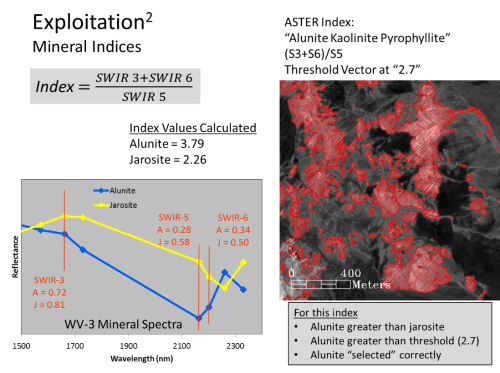
- Mineral Indices For more in-depth analysis, the next step is to create mineral indices using a combination of SWIR bands. These highlight mineral categories, are robust and reliable, and many remote sensing geologist are familiar with their significance from ASTER heritage. Index results can be converted to polygon vectors for export to other mapping software.
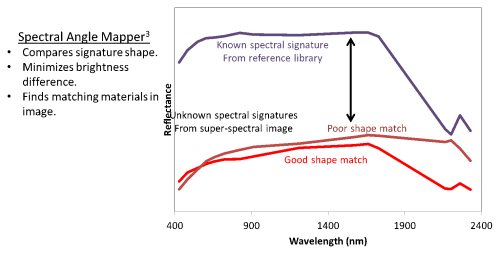
- Spectral Matching This step uses an algorithm to compare a mineral's known spectral signature from a reference library to the observations gleaned from SWIR imagery—allowing targeted on-the-ground resources to be allocated with confidence.
Automating Material and Mineral Mapping with GBDX
Because of the complexity and precision required, extracting information layers from spectral data has traditionally been the task of an expert. The Maxar GBDX platform has robustly automated these critical data processing steps. Whether an analyst wants a ready-to-use "data cube", or an information layer, GBDX is prepared for the task. Typically, a human analyst will still perform the final analysis and interpretation of the significance of the resulting information, or Material Layers. But the time consuming, complex, and error prone data handling steps are completed accurately, quickly, and reliably within GBDX. The core software processes are:
- Supercube This step prepares raw data by executing the following tasks: 1. AComp to compensate for the atmosphere and generate surface reflectance; 2. performs an accurate alignment of the SWIR pixels to the VNIR; and 3. resamples different pixel sizes to the same grid. The Supercube can be either an analysis-ready product for the spectrally-enabled customer, or it can be an input to additional material information extraction software.
- DG Layers This software generates Material Layers using a Supercube as input. A variety of literature and proprietary algorithms can be exploited depending on the target material sought. In general, the approaches consist of band math indices and spectral matching. Libraries of known spectral signatures can be exploited to search each image pixel for the signature of that material. Masking for undesirable categories is also performed. This includes categories such as clouds, shadows, water, and undesired vegetation.
- Vectorize Generates polygon vectors from raster detection maps. These can be easily exported to GIS software.
- Answer Factory Automates the selection of areas of interest and collection of satellite image strips.
Summary
Spectral reflectance signatures can be used to identify materials and minerals on the earth's surface. Multispectral VNIR bands on both WordView-2 and WorldView-3 lead the industry for high spatial and spectral resolution. Additional 8 SWIR bands on WorldView-3 enable a wide range of material and mineral identification from space. The SWIR bands also can penetrate smoke (but not clouds), and detect the thermal emission from fires. Software in GBDX has automated the critical data preparation, processing, and information extraction from these data. The resulting material and mineral layers give analysts a competitive advantage for diverse industries such as resource exploration, mining, energy, insurance, environment, and defense.
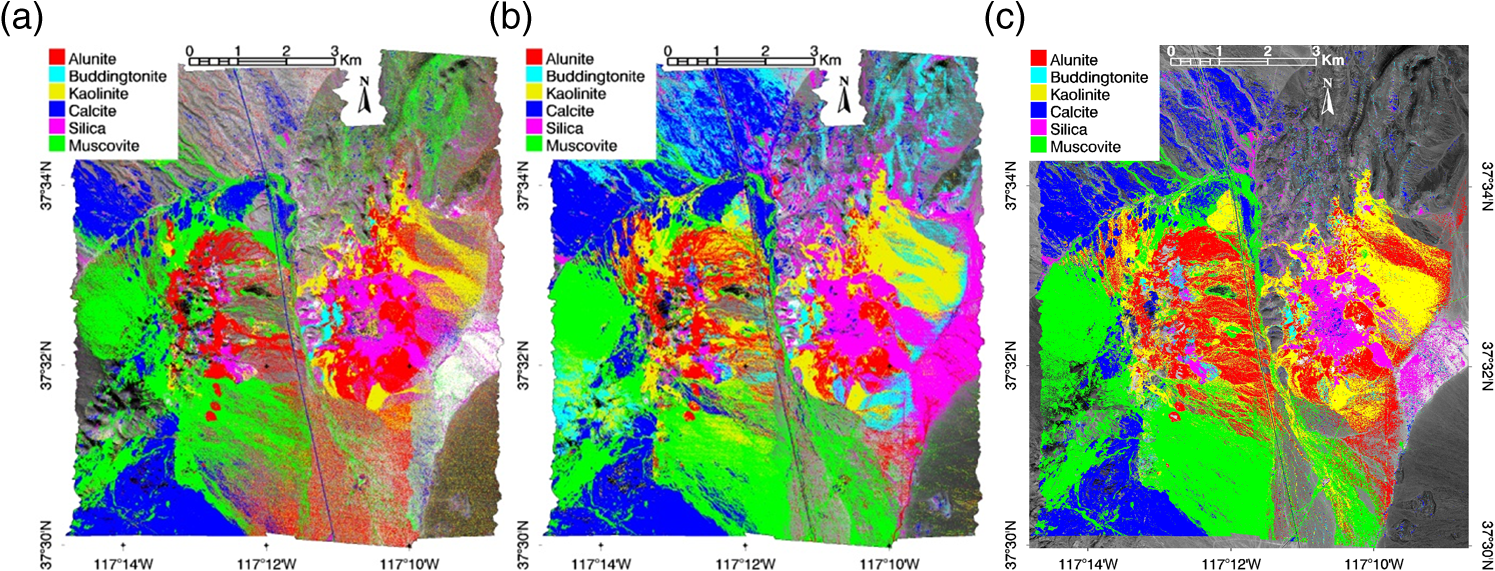
Mineral map showing Mineral Layers from WorldView-3. From: Kruse, Baugh, and Perry, 2015, Validation of Maxar WorldView-3 Earth imaging satellite shortwave infrared bands for mineral mapping, Journal of Applied Remote Sensing, v.9, p.1-17.
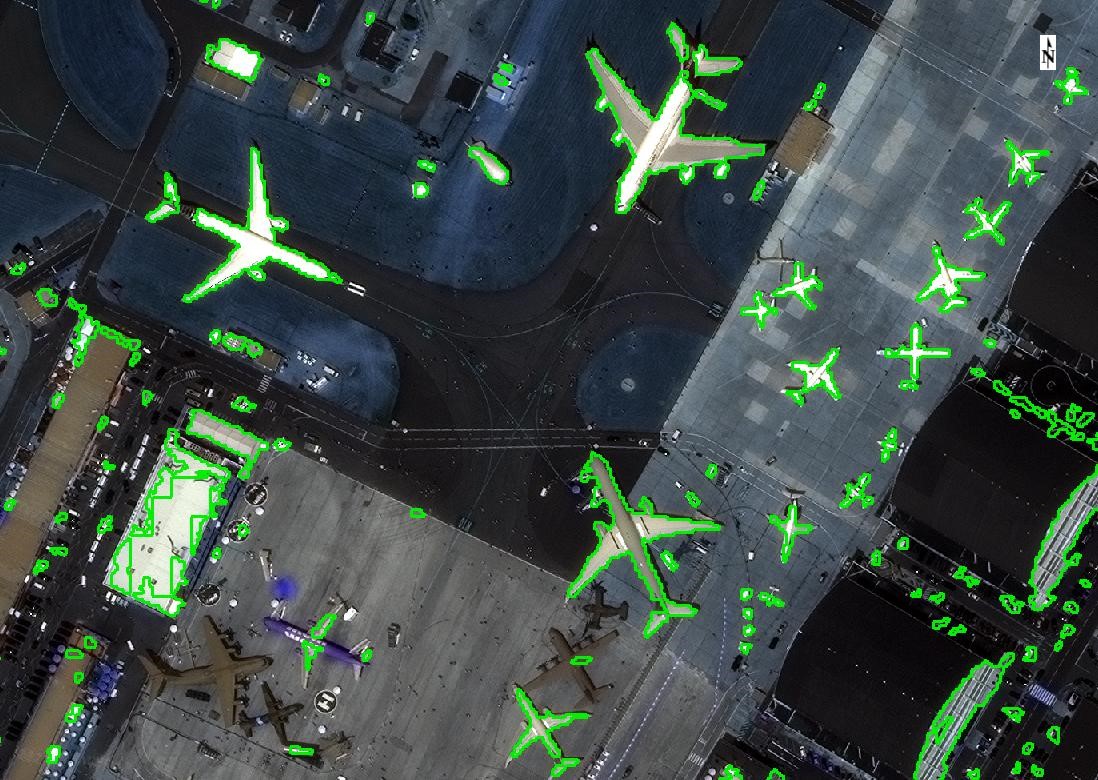
Vectorized white paint detections (in green) that were generated in GBDX. It shows detections of white aircraft paint as well as paint on buildings and cars.
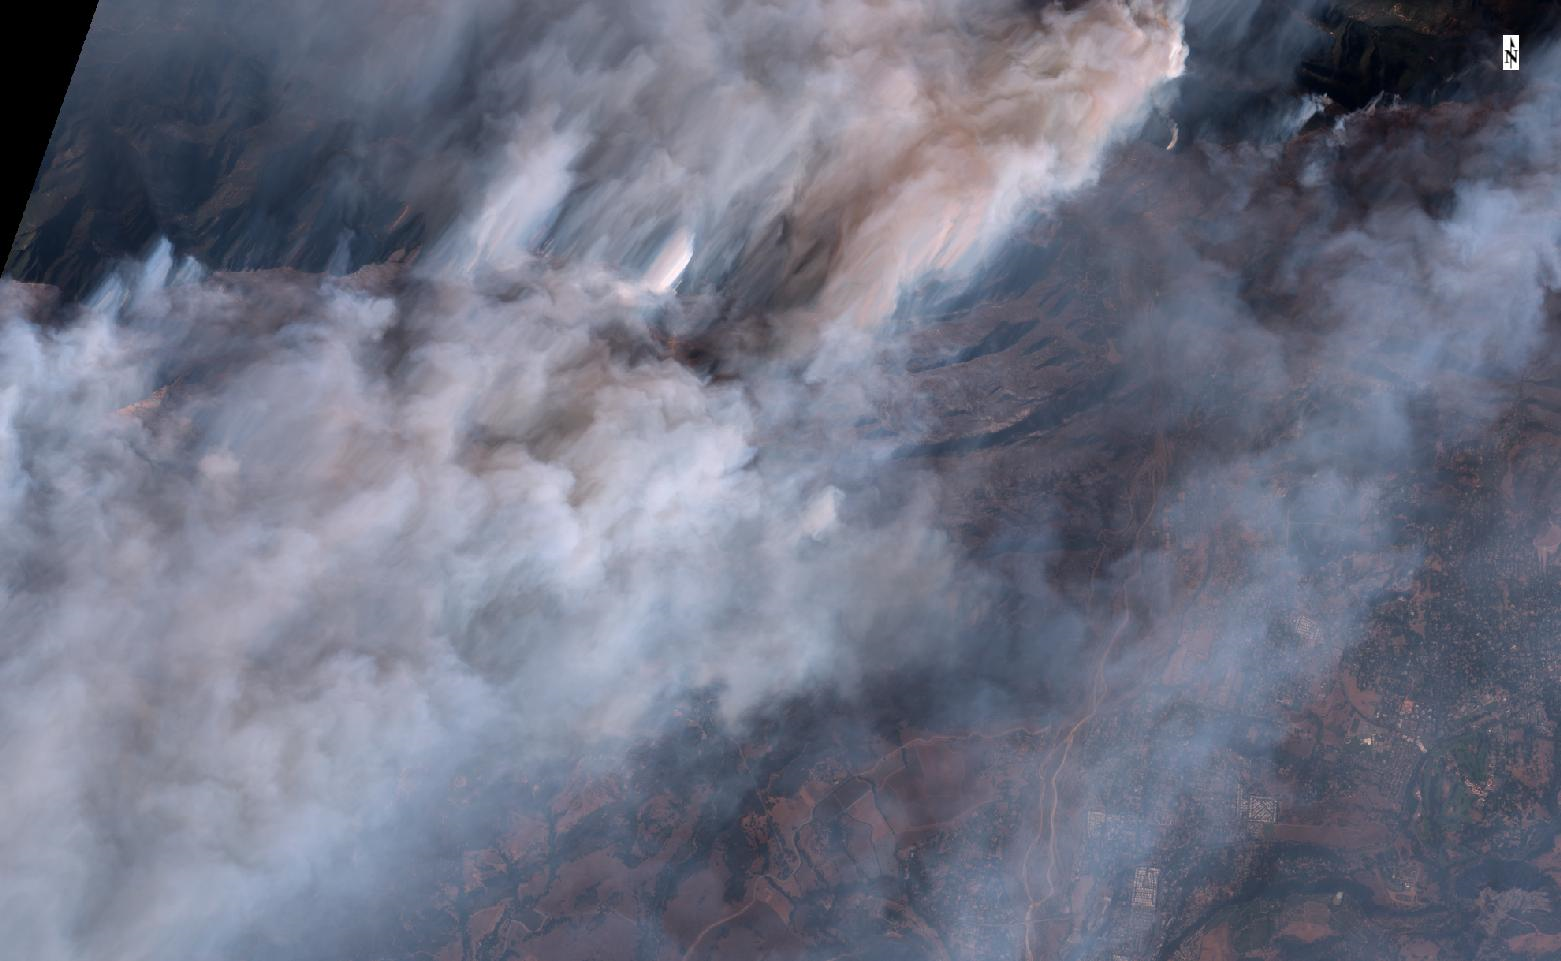
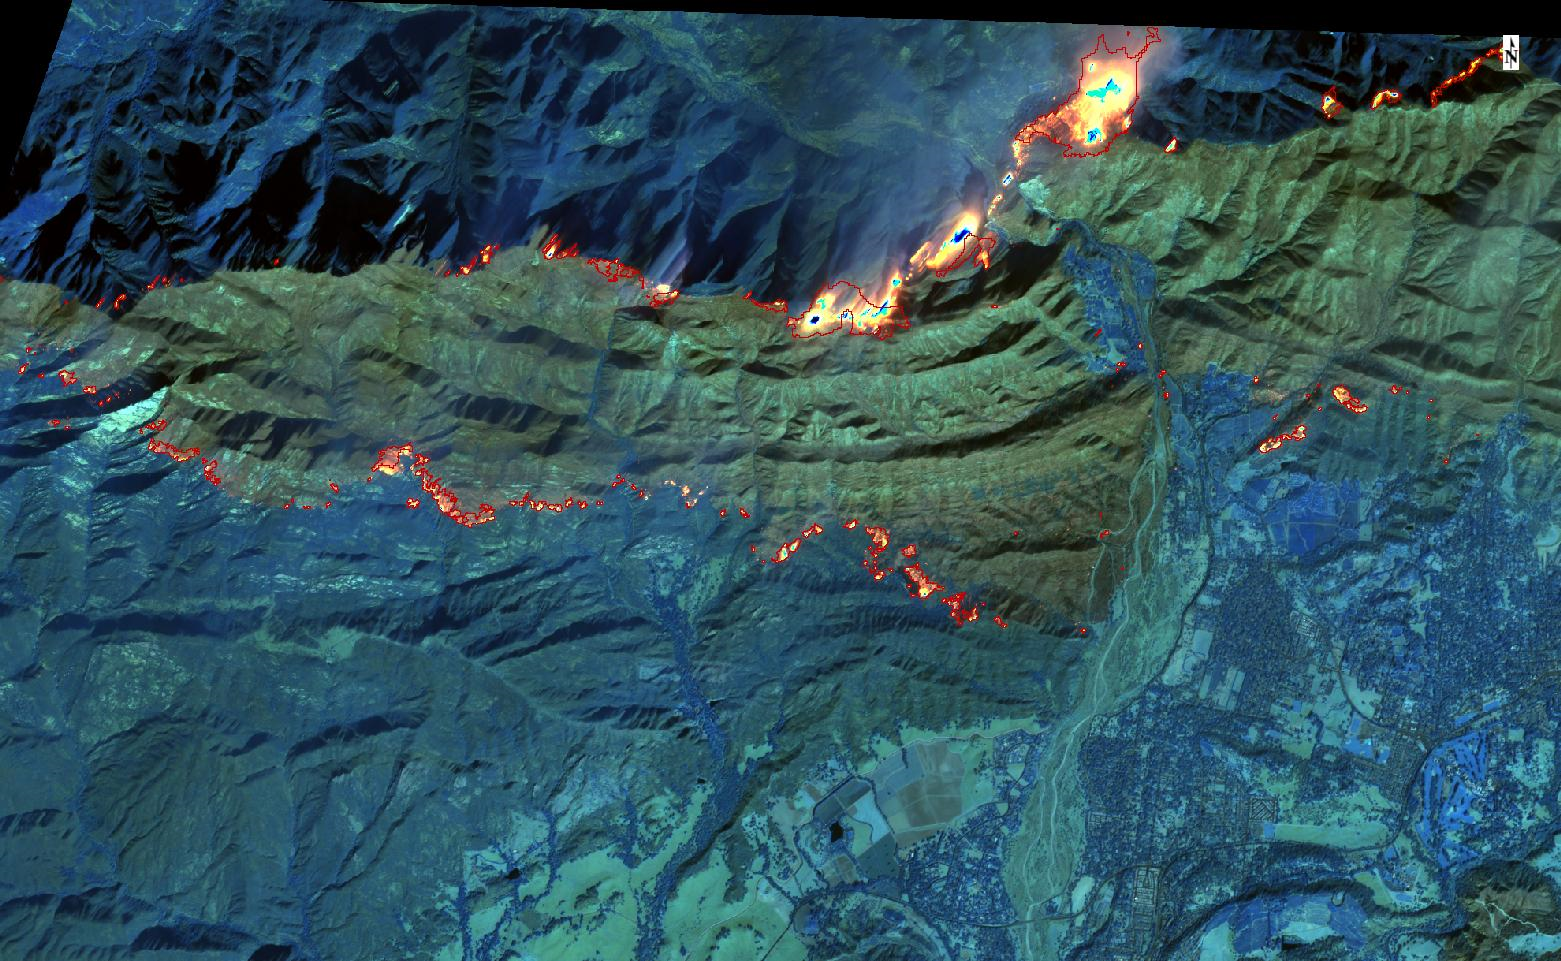
WorldView-3 images of California wildfires in December 2017. The top image is natural color and shows mostly smoke. The bottom image is a simultaneous SWIR image that penetrates smoke, shows the heat from the fire, and has red "Hotmap" fire detections vectors that were generated in GBDX.